Now that we’ve inspected the existing format, the next step is to design the Java data structures that will hold this information inside the program after it is parsed. Some times you’ll want to design custom Java classes that closely represent the data. If I were writing a budget analysis program, I might do that here. However, since we’re not planning on doing anything more complex than writing the data back out again as XML, the generic data structures in the Java Collections API will more than suffice.
There are an indefinite number of records from year to year as new budget items are added. Thus the list of records will be kept in a java.util.ArrayList. Any other form of java.util.List such as a Vector or a LinkedList would work equally well. After initial construction, I’ll only access this object through the methods of the abstract List superclass. The program will not depend on any implementation details of the list.
The records themselves can be represented as arrays, vectors, instances of a custom class, hashtables or maps. If the data is reasonably clean, I find it easier to use a custom class or a map. An array or vector works well when there may be extra data in some lines or perhaps missing information. In my initial experiments, the data proved to be fairly clean so I chose to use a Map. The keys will be reasonable approximations to the field names so they can be stored in a static array for easy extraction and iteration in a later part of the code. Again, there are no API calls that set this up for you. You have to do it yourself.
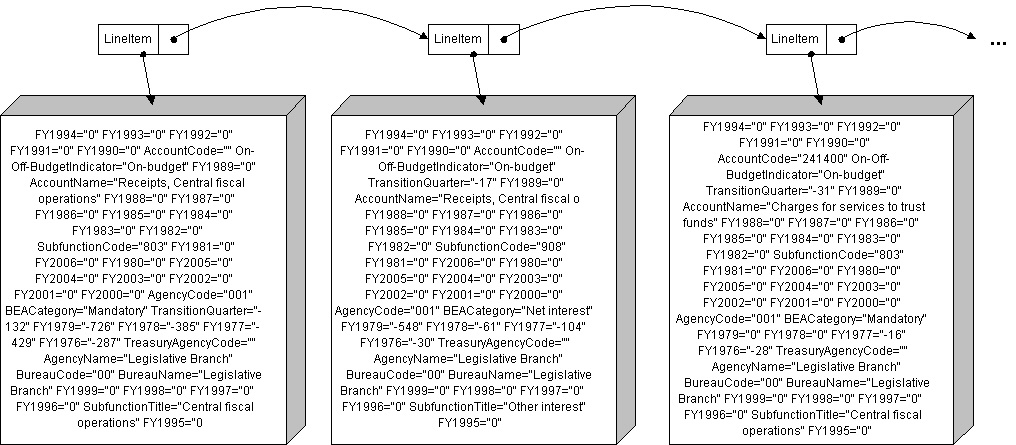
When complete, you’ll have a list of maps, one map for each record, as diagrammed in Figure 4.1. This is very close to the form of the input data. It will still need to be manipulated before it’s in the form for the output data. Some manipulations may be straightforward. For instance, it’s very easy to extract all the data for 1982. Just iterate through the list and pull out only the fields that are relevant to 1982 from each map. Other manipulations are more complex. For example, if you want to convert this into a hierarchical structure in which each bureau is part of its agency, you may need to use a sorted data structure or make multiple passes through the list. Maybe you want to reorganize the data by calendar year instead of fiscal year. And perhaps beyond merely reorganizing, you want to perform some calculations on the data, such as summing the total budget for each agency each year. Whatever output you want, it’s just a matter of writing the code to generate it. Once the input data has been parsed, it’s easy to write it out as XML.